Countries
A 33-year difference: what separates the longest- and shortest-lived countries
Life expectancy at birth runs from the low fifties to the mid-eighties. The distance is real, but a single national number compresses mortality at every age into one figure — and deaths at young ages weigh on it most heavily.
SnapLongevity5 min read
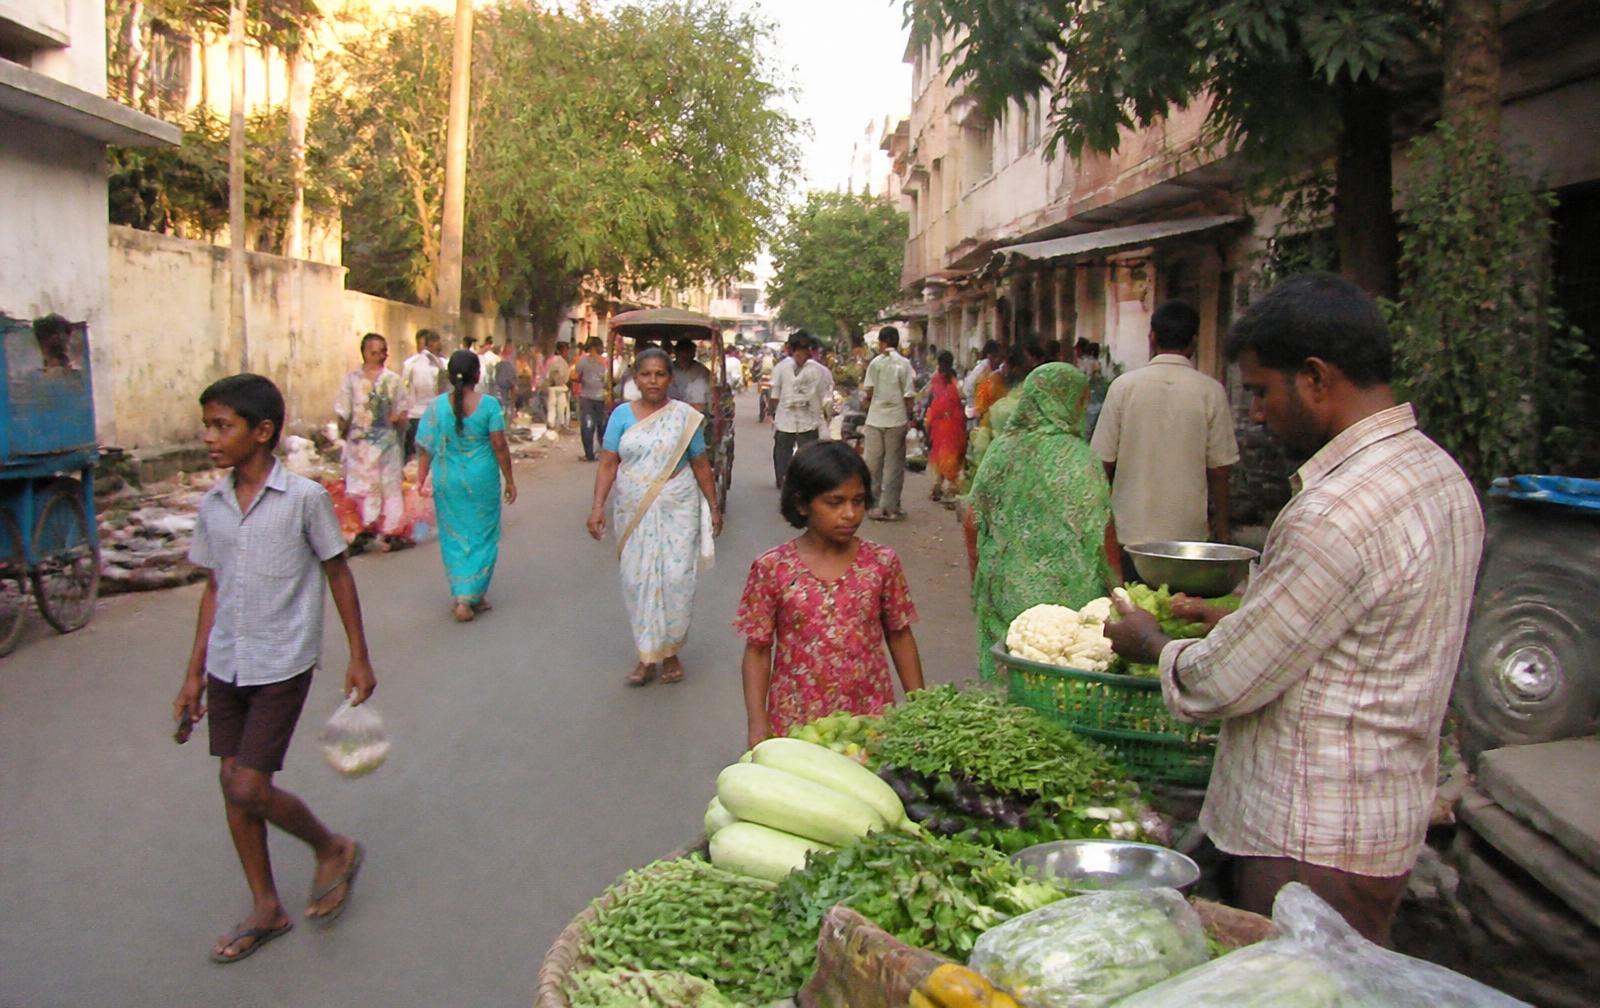
In the WHO Global Health Estimates for 2021, life expectancy at birth ranges from 51.5 years in Lesotho to 84.5 years in Japan. That is a spread of roughly 33 years between the extremes of the same measure in the same year, calculated the same way.
The first thing to understand about that number is what it is not. It is not the age people in either country typically reach, and it is not a statement about how long a child born today will live. It is a summary of the death rates observed at every age in a single year, expressed as the average lifetime those rates would produce. Which means the spread between countries depends on where in the age range the deaths are happening, and not only on how many there are.
How wide is the spread between countries?
Life expectancy at birth, one dot per country
Life expectancy at birth for 185 countries, running from 51.5 years in Lesotho to 84.5 years in Japan. Most countries sit between 65 and 80 years.
WHO Global Health Estimates, life expectancy at birth, both sexes, 2021, all 185 countries in the dataset. No country is excluded and no value is smoothed.
Regions differ, but they overlap more than the headline suggests
Grouped by WHO region, the medians line up in an order most readers would predict. What is less predictable is the width of each group: the range inside a single region is often larger than the distance between two regional medians.
Swipe the table sideways to see all columns.
| WHO region | Countries | Median | Range |
|---|---|---|---|
| Africa | 47 | 63.2 | 51.5–76.0 |
| Western Pacific | 22 | 70.2 | 60.9–84.5 |
| Eastern Mediterranean | 22 | 72.5 | 54.0–79.0 |
| Americas | 34 | 72.7 | 62.5–81.6 |
| South-East Asia | 10 | 72.9 | 67.3–77.2 |
| Europe | 50 | 76.6 | 69.1–83.3 |
WHO Global Health Estimates, life expectancy at birth, both sexes, 2021, all 185 countries in the dataset grouped by their WHO region. Median and range calculated from the unrounded values.
Africa's range covers nearly 25 years; Europe's covers 14. Regional medians are useful for seeing the broad ordering, but they hide substantial variation between countries in the same region, so a regional figure is a poor description of any individual country inside it.
What happens to the gap at older ages
The clearest way to see what a national figure is made of is to ask the same question again at a later age. At birth, Norway leads Nigeria by 19.5 years. Among people who have already reached the 80–84 age band, the same two life tables expect total ages of 89.0 and 87.1 years respectively — a difference of under 2 years.
That collapse is one of the most informative facts about country differences. Each death at a young age removes more potential years of life than a death in old age, so mortality early in life can exert a disproportionate effect on the at-birth average. Once a person has survived into old age, the difference between these two countries is comparatively small. Life expectancy at birth summarises mortality at every age, but the weight it gives to the youngest ages is what makes it move so far between countries. How remaining life expectancy behaves at older ages.
The explanations, and how much weight they carry
Cross-country data can rank and describe. It cannot isolate causes: countries differ in hundreds of ways at once, and a correlation between national income and national life expectancy does not establish what raising income in any one place would do. The explanations below come from research designed to address that problem, not from the ranking itself.
Preston's classic analysis established the shape of the income–mortality relationship: life expectancy rises steeply with income among poorer countries and then flattens, and — crucially — the whole curve shifted upward over the twentieth century. Preston attributed a large part of the improvement to factors other than income growth, which is why two countries at similar income levels can sit years apart.
Costa Rica is the standard illustration. Rosero-Bixby and Dow document adult mortality there that is lower than in the United States despite far lower income and health spending, with the advantage concentrated in cardiovascular mortality among men. Whatever produces long life, it is not purchased in a simple relationship with money.
In the other direction, Case and Deaton documented rising midlife mortality among middle-aged non-Hispanic white Americans from 1999 onward, driven by drug and alcohol poisonings, suicide and chronic liver disease, at a time when comparable countries continued to improve. A rich country can lose ground, and it can lose it at exactly the ages that move the at-birth figure most.
- Mortality at young ages — infant, child and maternal deaths — carries a large weight in the at-birth figure, because each such death removes more potential years than a death in old age.
- Infectious disease, water and sanitation, and immunisation coverage are prominent among the differences between countries at the lower end of the range.
- Tobacco and alcohol contribute to differences among countries that have already reduced early-life mortality; the alcohol research cited elsewhere on this site finds a meaningful contribution to the East–West difference in Europe.
- Injury, road traffic deaths and violence are concentrated in young adult ages, so they cost more expected years per death than their share of deaths suggests.
What a country ranking hides
Three things, mainly. It hides the distribution inside a country, where regional and socioeconomic differences within a single nation can be as large as differences between nations. It hides the sex difference, which varies from effectively nothing to ten years. And it hides the health of the years lived, which is a separate measure entirely. See healthy life expectancy by country.
Sources
- WHO Global Health Estimates: Life expectancy and healthy life expectancy (life tables by country, sex and age, 2021)
- Preston SH. The changing relation between mortality and level of economic development. Population Studies 1975; reprinted in International Journal of Epidemiology, 2007
- Rosero-Bixby L, Dow WH. Exploring why Costa Rica outperforms the United States in life expectancy. PNAS, 2016
- Case A, Deaton A. Rising morbidity and mortality in midlife among white non-Hispanic Americans in the 21st century. PNAS, 2015
- WHO fact sheet: Tobacco